

Research insights
Receipt scanning frequency on weekends and holidays: how to read it in iPanel INTAGE

On this page

How often shoppers record their receipts says a lot about the rhythm of shopping. Weekends and public holidays are when that rhythm is most likely to change, so receipt scanning frequency is a useful starting point for planning promotions, stock and staffing around peak days. This article explains what the measure shows, which questions it can answer and how to read it without overstating it.
What receipt scanning frequency measures
In iPanel INTAGE, INTAGE Vietnam’s shopper data platform, panel members photograph their receipts and scan product barcodes with a mobile app. A recorded receipt usually corresponds to one shopping trip, so the number of receipts per shopper in a period is a practical proxy for how often people shop.
The measure reflects two things at once: real shopping occasions and how consistently members record them. Keep both in mind before concluding that people shop more or less on a given day.
Questions to ask about weekends and holidays
- Do shoppers make more trips at weekends, or fewer but larger ones?
- Does spend per trip rise in the days before Tet and other major holidays?
- Which categories enter the basket on holiday trips, such as drinks, snacks, gifts or cooking ingredients?
- Do shoppers move between modern trade, traditional trade, e-commerce and eating or drinking out on these days?
- Does a holiday peak simply pull purchases forward, with a quieter period afterwards?
Measures that help
- Trips per shopper by day type: weekday, weekend and public holiday.
- Spend per trip, to see whether busy days bring bigger baskets or just more visits.
- Basket composition: which categories appear together on weekend and holiday receipts.
- Penetration: the share of shoppers who buy a category at least once during the holiday window.
- Channel share of trips and spend.
- Repeat purchase and switching: whether holiday buyers of a brand return afterwards or move to another brand.
What panel data can show, and what needs other sources
What the data can show
Because the panel follows the actual purchases of the same individual shoppers over time, it can show when, where and what people bought and how much they spent. Results can be compared across the five cities in the panel design (Hanoi, Ho Chi Minh City, Hai Phong, Da Nang and Can Tho) and across the published profile variables: gender, age, marital status and personal income.
What needs a survey or other sources
- why people shop more on certain days, and whether the trips were planned;
- who the purchases were for, such as family gatherings or gifts;
- how shoppers felt about crowds, queues or promotions;
- store traffic, including visits without a purchase, which needs retailer counts.
Panel data also does not prove on its own that a holiday or a promotion caused a change. It shows what changed and for whom.
Reading the data carefully
Assign each trip to the purchase date on the receipt, not the day it was recorded, and check whether recording slows during busy periods and catches up later. Compare each holiday with a suitable baseline. Tet falls on a different Gregorian calendar date each year, so compare holiday windows rather than calendar dates. Holiday windows are short, so check how many shoppers stand behind each figure before splitting results by city or profile.
Practical steps
- Define day types and holiday windows: before, during and after each event.
- Choose a baseline of comparable ordinary weeks.
- Track trips per shopper and spend per trip side by side.
- Break results down by category and channel.
- Add a short survey if you need to know why patterns change.
- Use the findings to time promotions, stock and staffing.
Conclusion
Receipt scanning frequency is a simple measure with practical uses, as long as it is read as recorded shopping behavior rather than a full explanation. Combined with spend per trip, basket composition and channel share, it shows how shopping on weekends and holidays differs from ordinary days. A survey can then explain why.
Contact us today for tailored consultation!
INTAGE Vietnam: Your trusted partner for comprehensive and effective market research solutions.
📞 (+8428) 3820 5558
🌐 https://intage.com.vn/
🏢 1st floor, Citilight Tower, 45 Vo Thi Sau St., Tan Dinh Ward, HCMC
Related reading


Latest posts
 Survey Sample Size: How Many Respondents Are Enough?
 Survey Data Collection Methods in Vietnam: How to Choose
- Technology Adoption in Enterprises: How to Research Employee Behavior
 How to Write a Market Research Brief for an Accurate Quote
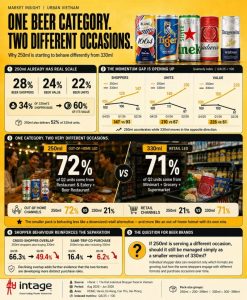 Beer in Vietnam: Why the 250ml Can Is Behaving Differently From 330ml