Qualitative Data and Actionable Charts

Qualitative Data and the Importance of Actionable Insights
Qualitative data is information that cannot be measured quantifiably and is often descriptive, emotional, or personal experience. This type of data is typically collected from interviews, surveys, and customer feedback. In the context of actionable insights, qualitative data becomes extremely important as it provides deep insights into customer needs and expectations, helping businesses adjust and optimize their product and service strategies.
Method and Business Context
Qualitative charts should preserve meaning, not just count words. Teams should code responses into themes, keep representative customer language, and separate frequency from importance. INTAGE Vietnam can support market research services that turn interviews, open-ended survey responses, and customer feedback into decision-ready insight.
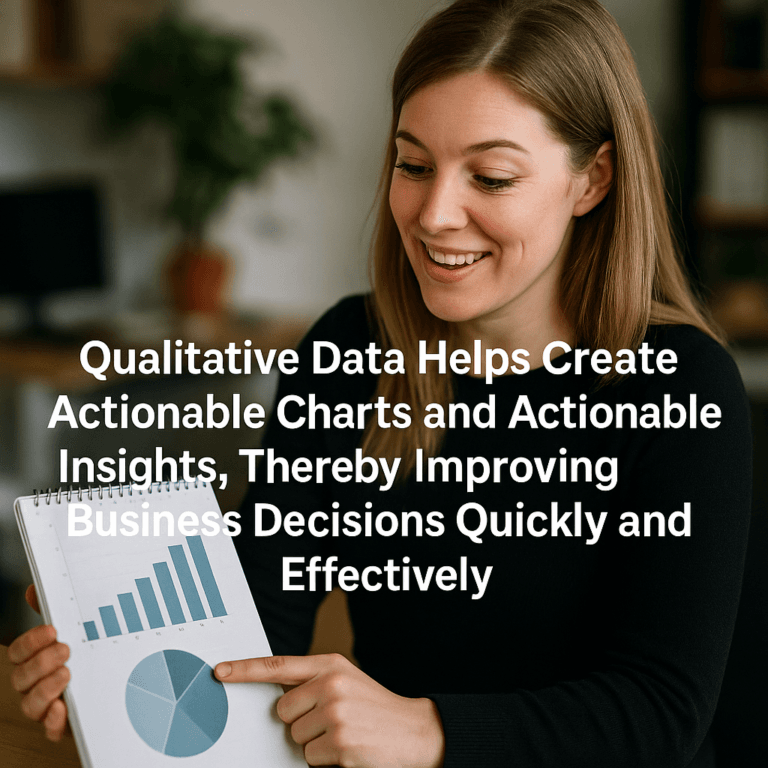
Transforming qualitative data into actionable charts provides powerful visualizations that enable managers and staff to easily identify potential business issues and opportunities. These insights help make quick decisions and allow businesses to remain competitive in a volatile market.
Challenges When Working with Qualitative Data
Although qualitative data brings many benefits, it also poses several challenges. How is qualitative data different from quantitative data? While quantitative data can be easily measured and analyzed clearly, qualitative data is often influenced by many subjective factors and unclear criteria. Analyzing qualitative data requires more complex methods, sometimes requiring high expertise in the field of market research.
When transforming qualitative data into visual charts, researchers may struggle to find common patterns from the diverse and inconsistent information. Furthermore, choosing the right tools to visualize qualitative data is also a significant challenge, as not all tools adequately support this type of data.
Transforming Qualitative Data into Actionable Charts
To turn qualitative data into actionable charts, there are key steps that need to be taken:
- Collect and process qualitative data: Start with collecting data from sources such as surveys, interviews, and customer feedback. This data needs to be organized and categorized before proceeding with the analysis.
- Analyze the data: Look for key themes and important patterns. Use content analysis or thematic analysis methods to identify key factors and extract insights.
- Use visualization tools: Choose appropriate tools, such as Tableau or Power BI, to create actionable charts from the analyzed data. This helps visualize the insights clearly and attractively.
Types of Charts Suitable for Representing Qualitative Data
Once qualitative data has been transformed into actionable charts, there are various types of charts that businesses should consider:
- Sentiment charts: Provide an overview of customer sentiments towards products or services.
- Theme frequency charts: Display the prevalence of themes or opinions within the qualitative data.
- Network diagrams: Illustrate relationships and connections between factors or opinions in the data.
- Actionable insights charts: Directly indicate actions to be taken based on the insights obtained.
Practical Example: Creating Actionable Charts from Customer Data
To illustrate this process, a practical example is a large retail company that conducted a customer perception survey on a newly launched product. Through analyzing the qualitative data collected from feedback, the business identified key factors that customers cared about, such as product quality and pricing. By using visualization tools, they created theme frequency charts to show the popularity of each factor.
Furthermore, they combined this information with sentiment charts to assess customer psychology, thereby developing timely and accurate product improvement strategies.
Tools and Software to Support Transforming Qualitative Data into Charts
Currently, there are many tools and software available in the market to assist with researching and visualizing qualitative data. Some popular tools include:
- Tableau: Very powerful in creating graphics and charts, easily connects to various data sources.
- Power BI: Popular for its user-friendliness and ability to integrate with other systems.
- NVivo: Suitable for text analysis and other qualitative data, helping to identify themes and patterns.
- QDA Miner: Offers powerful features for qualitative data analysis and has good visualization capabilities.
Each tool has its own advantages and disadvantages, so choosing the right tool depends on the specific requirements of each project.
Applications of Actionable Insights in Business and Improving Decision-Making
The actionable insights generated from transforming qualitative data can have a significant impact on decision-making. For instance, when a business uses actionable charts to identify the benefits and weaknesses of a product, they can quickly improve product quality and marketing strategies.
Industries such as retail, healthcare, and customer service can effectively apply actionable insights to enhance workflow processes and improve the quality of customer service.
Conclusion and Recommendations When Working with Qualitative Data
Transforming qualitative data into actionable charts not only helps businesses easily visualize information but also aids in making smarter decisions. To optimize this process, businesses should ensure they collect data from various sources, apply effective data analysis and visualization tools, and maintain consistency in their analytical processes.
In summary, the act of turning qualitative data into actionable insights through actionable charts is not just a modern approach but also an essential factor for success in today’s business landscape.
Contact us today for tailored consultation!
Intage Vietnam: Your trusted partner for comprehensive and effective market research solutions.
📞 (+8428) 3820 5558
🌐 https://intage.com.vn/
🏢 1st floor, Citilight Tower, 45 Vo Thi Sau St., Tan Dinh Ward, HCMC