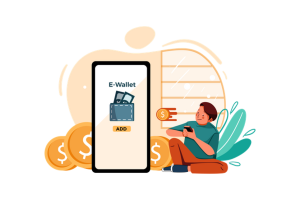
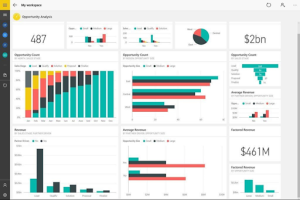
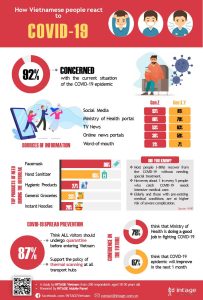
INTAGE Inc. is the largest marketing research company in Asia. Previous slide Next slide Top Services CUSTOMIZED RESEARCH ONLINE RESEARCH HEATHCARE RESEARCH MARKET AND EXPERIMENTAL ACTIVITY AUDIT AUTOMOBILE SECTOR MORE SERVICES Valued Clients Previous Next Why INTAGE Vietnam ? Years Understanding local insights 0 Categories coverage 0 Projects Conducted 0 Respondents database 0 Client & Partners 0 Mobile active panellists 0 More Detail Please contact us if you like detailed information. Contact Us -> Viettrack THE GROWING TREND OF USING MULTIPLE E-WALLET PLATFORMS FOR DIGITAL PAYMENTS June 11, 2023 Data Visualization Service June 9, 2023 Coronavirus Pandemic: How do Vietnamese react? June 9, 2023 « Previous Page1 Page2 Page3 Page4 Page5 Next » Vieview [Article] “Mini supermarket sales increased +40% YOY thanks to easy shopping and reasonable prices” from ACCESS (Jun. 2023) July 21, 2023 [Article] “Japanese women’s purpose of travel to Vietnam is to eat food – The variety of Vietnamese ingredients has increased in Japan” from ACCESS (May. 2023) July 4, 2023 [Article] “97.3% of Vietnamese feel happy- it’s related to [Freedom of choice of life] and [tolerance] are related” from ACCESS (Apr. 2023) May 17, 2023 « Previous Page1 Page2 Page3 Page4 Page5 Next » 4.7/5 - (6 votes)
[Article] “Mini supermarket sales increased +40% YOY thanks to easy shopping and reasonable prices” from ACCESS (Jun. 2023) July 21, 2023
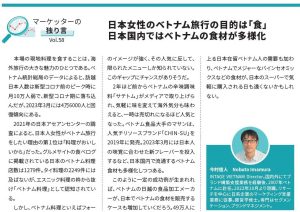
[Article] “Japanese women’s purpose of travel to Vietnam is to eat food – The variety of Vietnamese ingredients has increased in Japan” from ACCESS (May. 2023) July 4, 2023
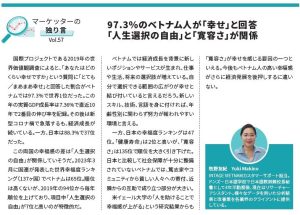
[Article] “97.3% of Vietnamese feel happy- it’s related to [Freedom of choice of life] and [tolerance] are related” from ACCESS (Apr. 2023) May 17, 2023